6 hits
Heat dissipation layout, discharge power, and cell temperature
Battery Thermal Management Simulation Analysis
Hypermesh software is used for pre-processing of the battery pack PACK modeling and meshing. COMSOL software is applied to establish a thermal-fluid-structure coupling simulation model for the battery pack, enabling simulations of temperature changes inside the battery pack under various conditions such as low-temperature parking heating, normal-temperature driving, and high-temperature driving. Additionally, it realizes simulations of pressure drop and flow uniformity inside the liquid cooling system, providing a reasonable basis for the design of cold plate structures.
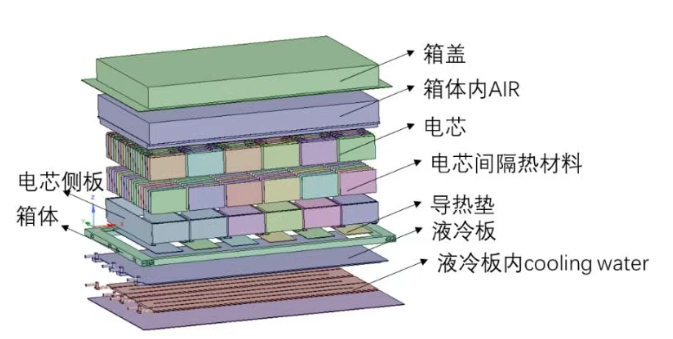
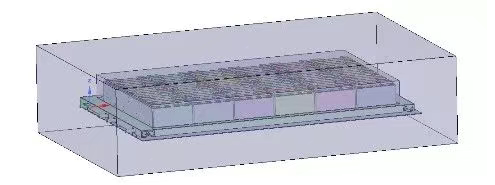
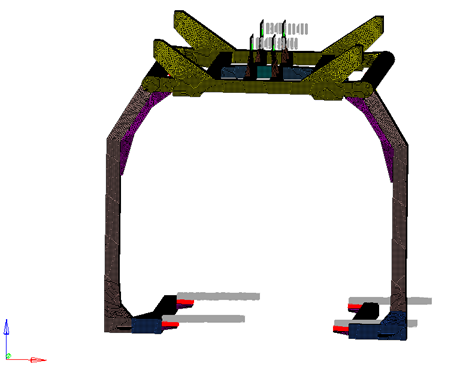
Figure 2 Exploded View of the Simplified PACK System Model
I. Model Simplification
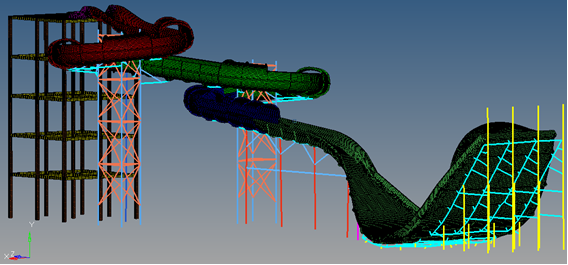
By analyzing the structural composition of the digital model and the role of each component, the impact of each part on the thermal system was evaluated to determine whether to retain, simplify, or discard components. The principle of model simplification is to reduce the number of meshes, improve mesh quality, and enhance computational efficiency while ensuring simulation accuracy as much as possible. Figures 3 and 4 show the power battery module models before and after simplification, respectively.
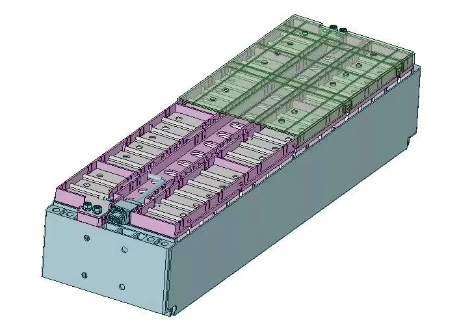
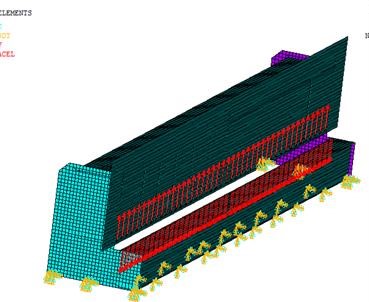
Figure 3 Model before Simplification
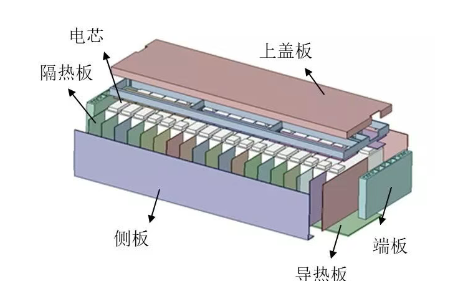
Figure 4 Model after Simplification
Flow Field Simulation: When processing the geometric model, the inner diameter of all pipes and the size of the flow channels in the liquid-cooled plate should remain unchanged. Details such as pipe bends, diameter changes, and local elbows should be retained. The water pipes must be free of distortion with smooth corner transitions, and the simplified joints should be well-assembled. The exterior of pipes, joints, and cold plates can be appropriately simplified to reduce the number of meshes.
- Thermal Simulation: Components such as wire harnesses, lifting lugs, screws, nuts, copper bars, and BMS management parts have little impact on the thermal management system and can be discarded. Geometric features of parts that have a greater impact on the thermal management system can be appropriately simplified, such as chamfer structures and structural alignment.
- Finite Element Model Correction: Elements in the stiffness matrix, mass matrix, and even damping matrix of the finite element model. The correctness of the model is ensured by checking the warpage, distortion, maximum angle, minimum angle, squareness, and normal direction of the elements.
II. Thermal Management Design
To keep power batteries operating within a reasonable temperature range, the battery pack must be equipped with a scientific and efficient thermal management system, which mainly has the following functions:
1. Accurate measurement and monitoring of battery temperature;
2. Effective heat dissipation and ventilation when the battery pack temperature is too high;
3. Rapid heating under low-temperature conditions to ensure the normal operation of the battery pack;
4. Ensuring uniform temperature distribution in the battery pack.
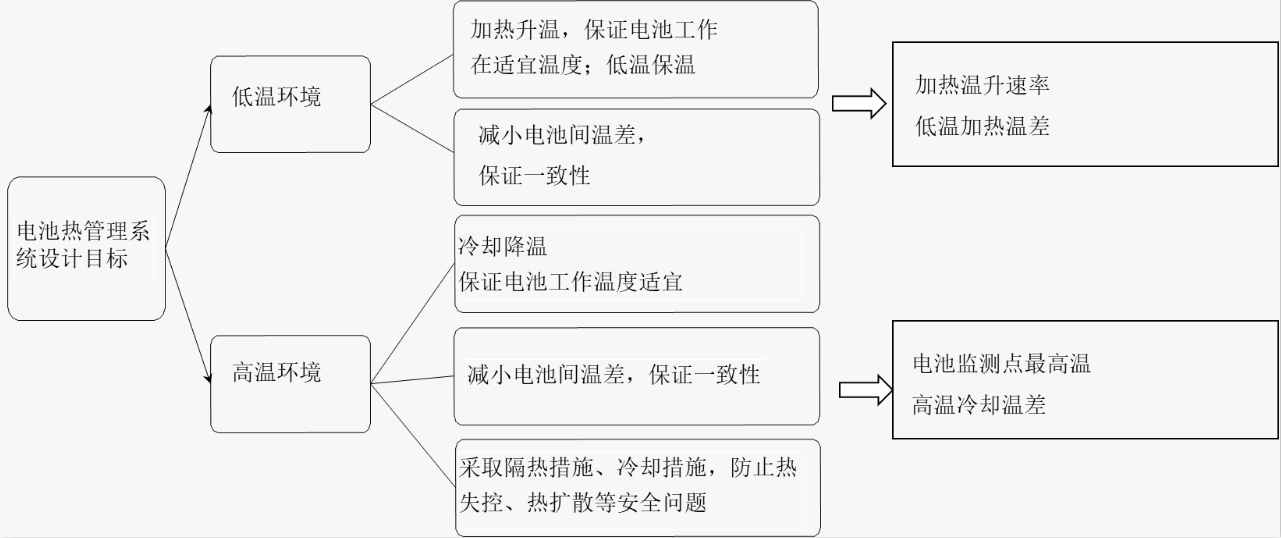
Figure 5 Structural Diagram of the Thermal Management System Design
III. Simulation Analysis
In lithium battery Pack design, thermal-fluid simulation analysis is often used to assist engineers in completing the Pack thermal management system design. In the thermal management system design stage, thermal field simulation analysis can be performed on the Pack, modules, or batteries, and cooling, heating, and thermal insulation methods can be quickly selected based on the simulation results. In the cooling subsystem design stage, thermal and flow field simulation analysis can be conducted on the Pack, modules, or batteries (with cooling subsystems), and the cooling channel design, cooling medium, cooling inlet temperature and flow rate, as well as parameters of fans or pumps, can be determined based on the simulation results.
The following case is a simulation analysis of a liquid cooling system: During operation under specified conditions, the maximum temperature of the cells inside the battery system is less than 50℃; the temperature difference between cells is ≤5℃; the pressure drop of the liquid cooling system is less than 10kPa. Based on the heat generation data of the cell monomer in the figure below, the heat generation power of the battery system under 1C full discharge is calculated.
The volume fraction of two-phase materials at the inlet is set as: cooling water: air = 1:0.
The volume fraction of two-phase materials at the outlet is set as: cooling water: air = 0:1.
The inlet mass flow rate is defined as: 4L/min.
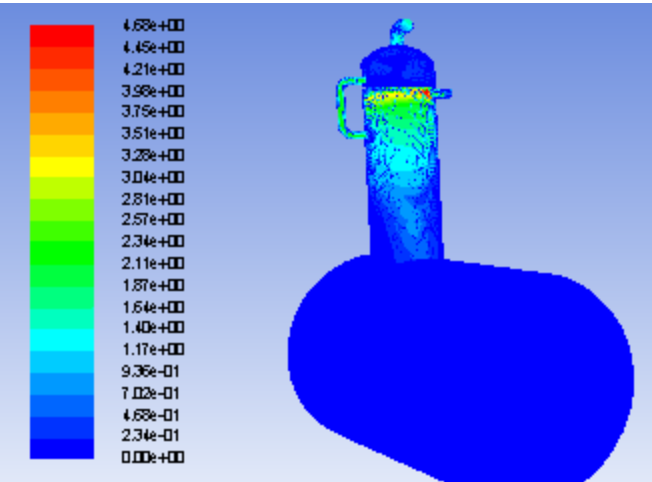
From Cloud Map 6, it can be seen that the coolant fills the entire inner cavity of the liquid-cooled plate in less than 1 minute. At the same time, there is a vortex phenomenon in the turning area of the flow channel, indicating room for optimization.
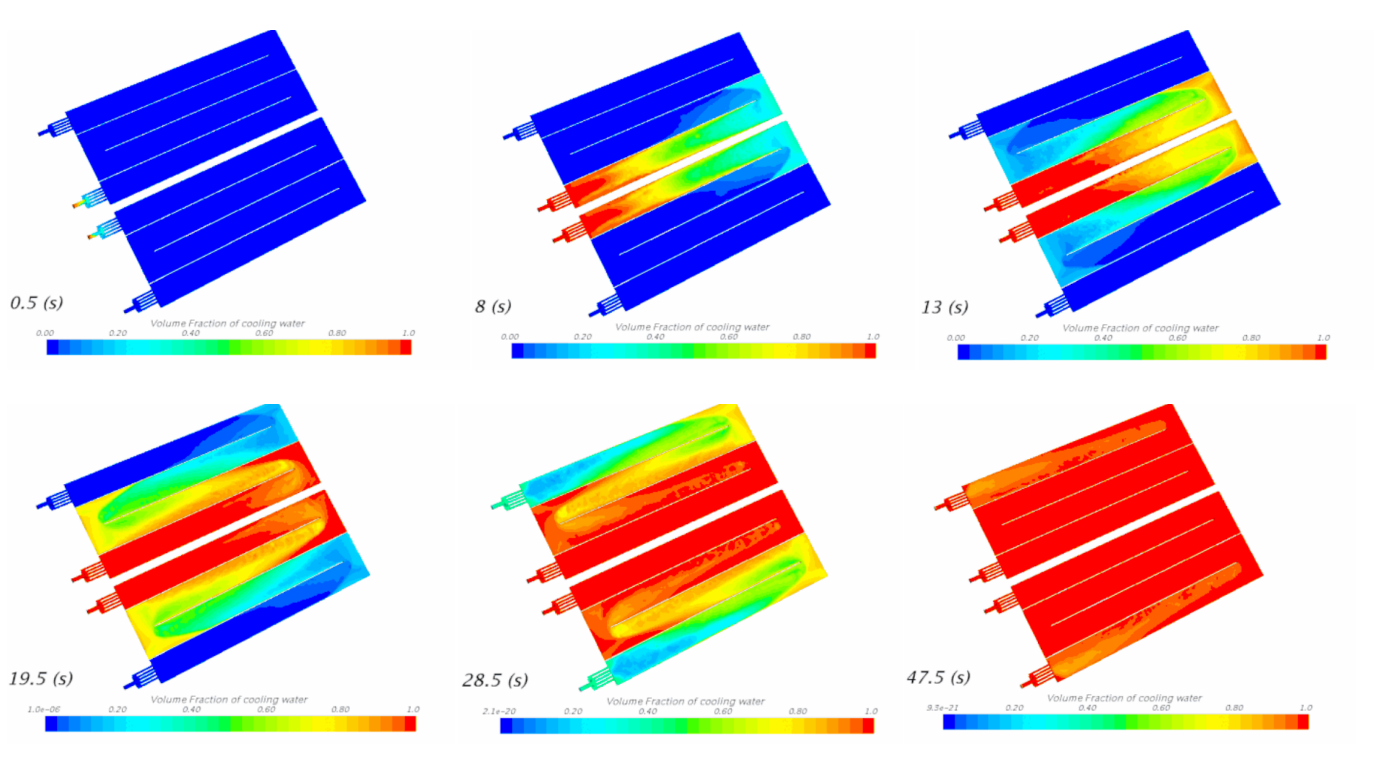
Figure 6 Flow Cloud Map of Coolant
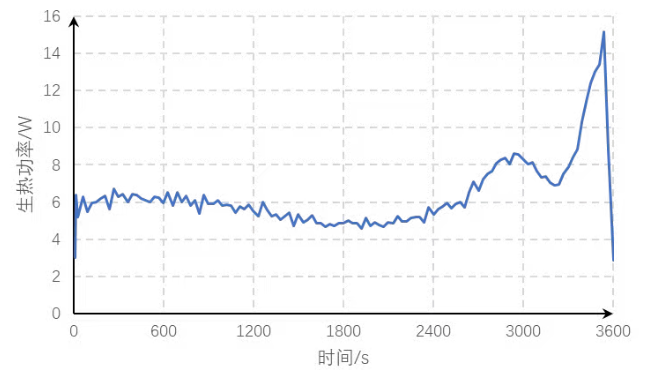
Figure 7 Heat Generation Power under 1C Discharge
Figure 8 shows the pressure cloud map of the liquid cooling system calculated by COMSOL simulation software. From the simulation results, the pressure drop of the system is 1.8kPa. The entire system adopts a two-inlet and two-outlet parallel structure, and the uniformity of flow rate certainly meets the design requirements.
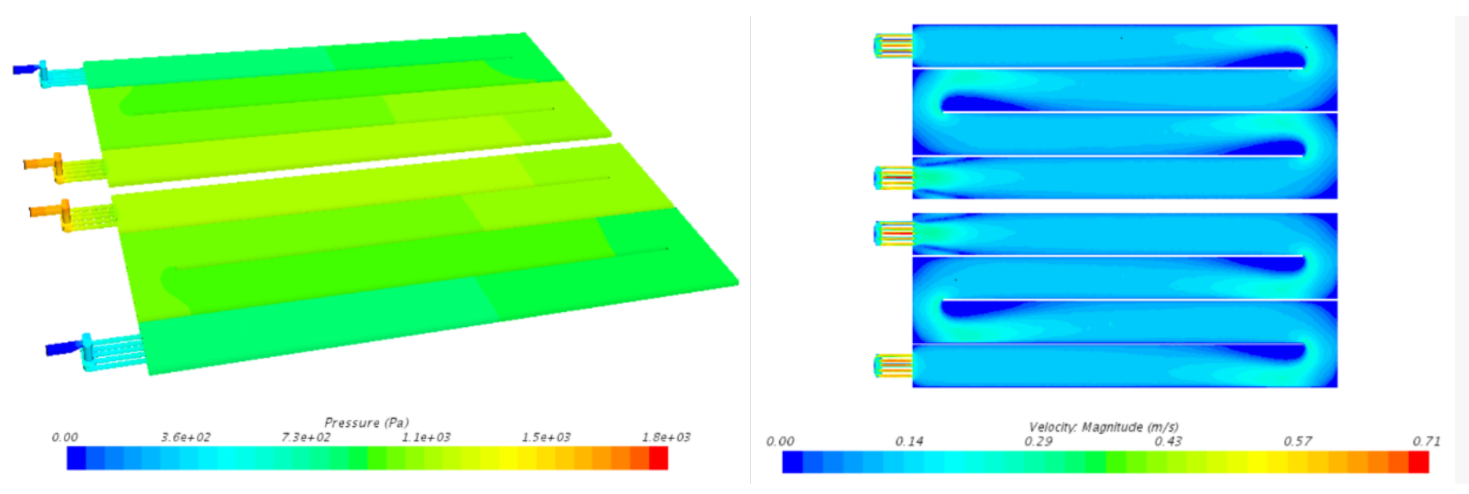
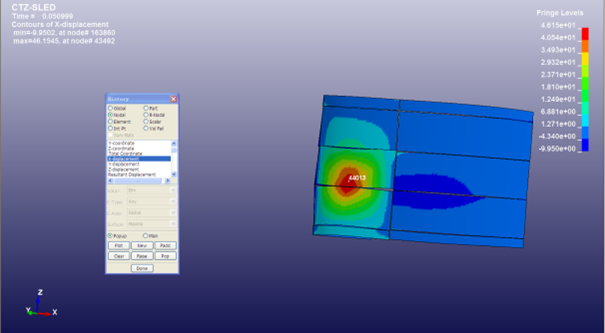
Figure 8 Temperature Cloud Map of the Battery System over Time
This condition simulates the high-temperature cooling condition of the battery system when the new energy vehicle is driven at high speed after being exposed to the sun outdoors all day in summer. From the high-temperature cooling cell temperature change curve in Figure 10, it is analyzed that under the 1C full discharge condition, with the cooling system in operation, the maximum temperature is 40.6℃, and the maximum temperature difference between cells is 1.8℃, meeting the thermal design goals. A temperature rise phenomenon appears at the end of the curve. As can be seen from Figure 7, the heat generation of the cells at the end of discharge is relatively large. Through calculation, the average heat generation of the cells in Stage Ⅱ is 1.8 times that in Stage Ⅰ, leading to the temperature rise at the end of the curve.

Figure 9 Temperature Change Cloud Map of Cells under High-Temperature Cooling
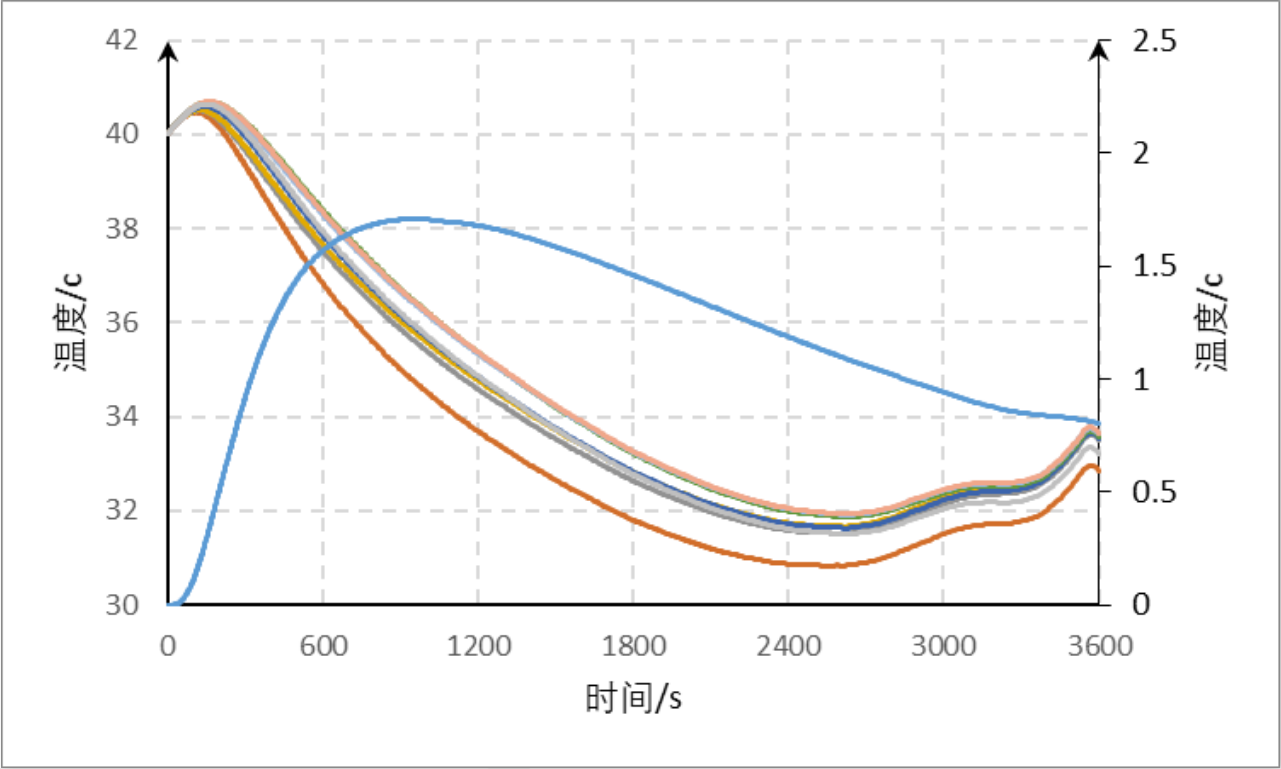
Figure 10 Temperature Change Curve of Cells under High-Temperature Cooling
Figure 11 shows the temperature cloud map of the battery temperature over time under normal-temperature high-speed driving conditions, which simulates a driver driving at high speed on the highway under general normal-temperature conditions.
The initial ambient temperature is 20℃. The cooling system is turned on when the minimum temperature of the monitoring point is greater than 38℃. The flow rate of a single inlet of the coolant is 4L/min, and the inlet temperature is 22℃. Figure 14 is the temperature change curve of the cell monitoring point during normal-temperature driving. The entire condition is divided into two working processes: Stage Ⅰ (0-3368s) when the liquid cooling system is not turned on, and Stage Ⅱ (3369s-3600s) when the liquid cooling system is turned on.
In Stage Ⅰ, the cell temperature continues to rise with discharge. At 3368s, the minimum temperature is 38℃, and the temperature difference is 3.1℃, meeting the system design goal of 5℃. In Stage Ⅱ, the liquid cooling system starts cooling at 3369s, but the temperature continues to rise. This is partly due to thermal inertia and partly because the heat generation of the cells doubles at the end of discharge, which is the main factor causing the cell temperature to continue rising after the cooling system is turned on.
At 3548s, the cell temperature begins to drop due to the action of the cooling system. The maximum temperature during the entire process is 42.7℃, and the maximum temperature difference is 3.2℃, meeting the design goals.

Figure 11 Temperature Change Cloud Map of Cells under Normal-Temperature High-Speed Driving
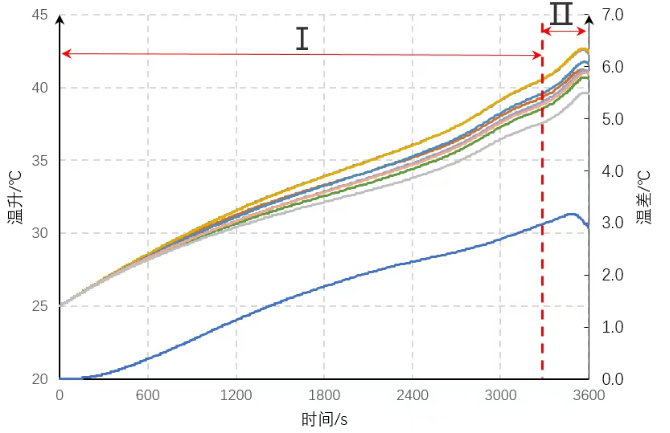
Figure 12 Temperature Change Curve of Cells under Normal-Temperature High-Speed Driving
Figure 13 shows the temperature cloud map of the battery system over time under low-temperature conditions, which simulates the working condition of a new energy vehicle being parked in a garage overnight in a cold winter, then starting the vehicle to heat the battery to an operational temperature and driving at high speed.
The initial ambient temperature is -20℃. The liquid cooling system is turned off when the minimum temperature of the monitoring point is not less than 5℃. The flow rate of a single inlet of the coolant is 4L/min, and the inlet temperature is 30℃.
The entire simulation process includes low-temperature heating and 1C discharge conditions. Under low-temperature heating conditions, the maximum temperature of the cell monitoring point is 10.9℃, the maximum temperature difference is 6℃, and the heating rate of the liquid cooling system is 1.6℃/min. Under the 1C discharge condition, the maximum temperature of the detection point is 30℃, and the temperature difference at the end of discharge is within 3.7℃. The overall temperature difference first increases and then decreases: heating enlarges the cell temperature difference, while the temperature difference decreases during discharge, mainly because each cell generates the same amount of heat during discharge, and the heat generation is more uniform than the heating heat at the bottom of the cells.
Figure 13 Temperature Change Cloud Map of Cells under Low-Temperature Heating
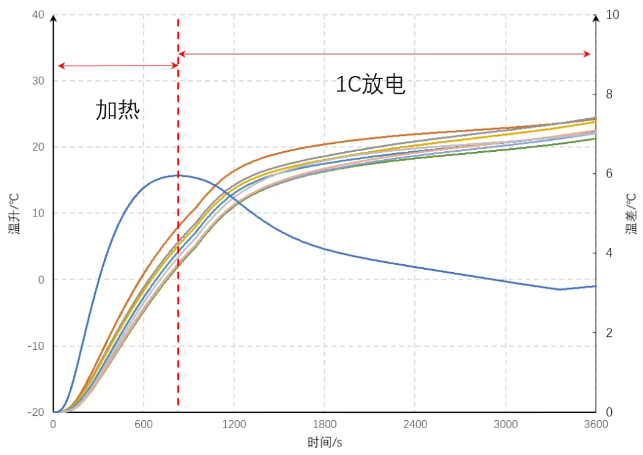
Figure 14 Temperature Change Curve of Cells under Low-Temperature Heating
Contact:
Prof. Tian:WhatsApp:+86 15029941570 | Mailbox:540673737@qq.com
we specialize in CAE finite element calculation and simulation, virtual prototyping and simulation testing, and product design optimization for enterprises and institutions.


Copyright © 2025.Boye Engineering Technology All rights reserved. Yue ICP17017756Num-1